Science · Middle School · Grades 6-8 · Presentations
NGSS
By GradingPal Team · July 4, 2026 · 7 min read
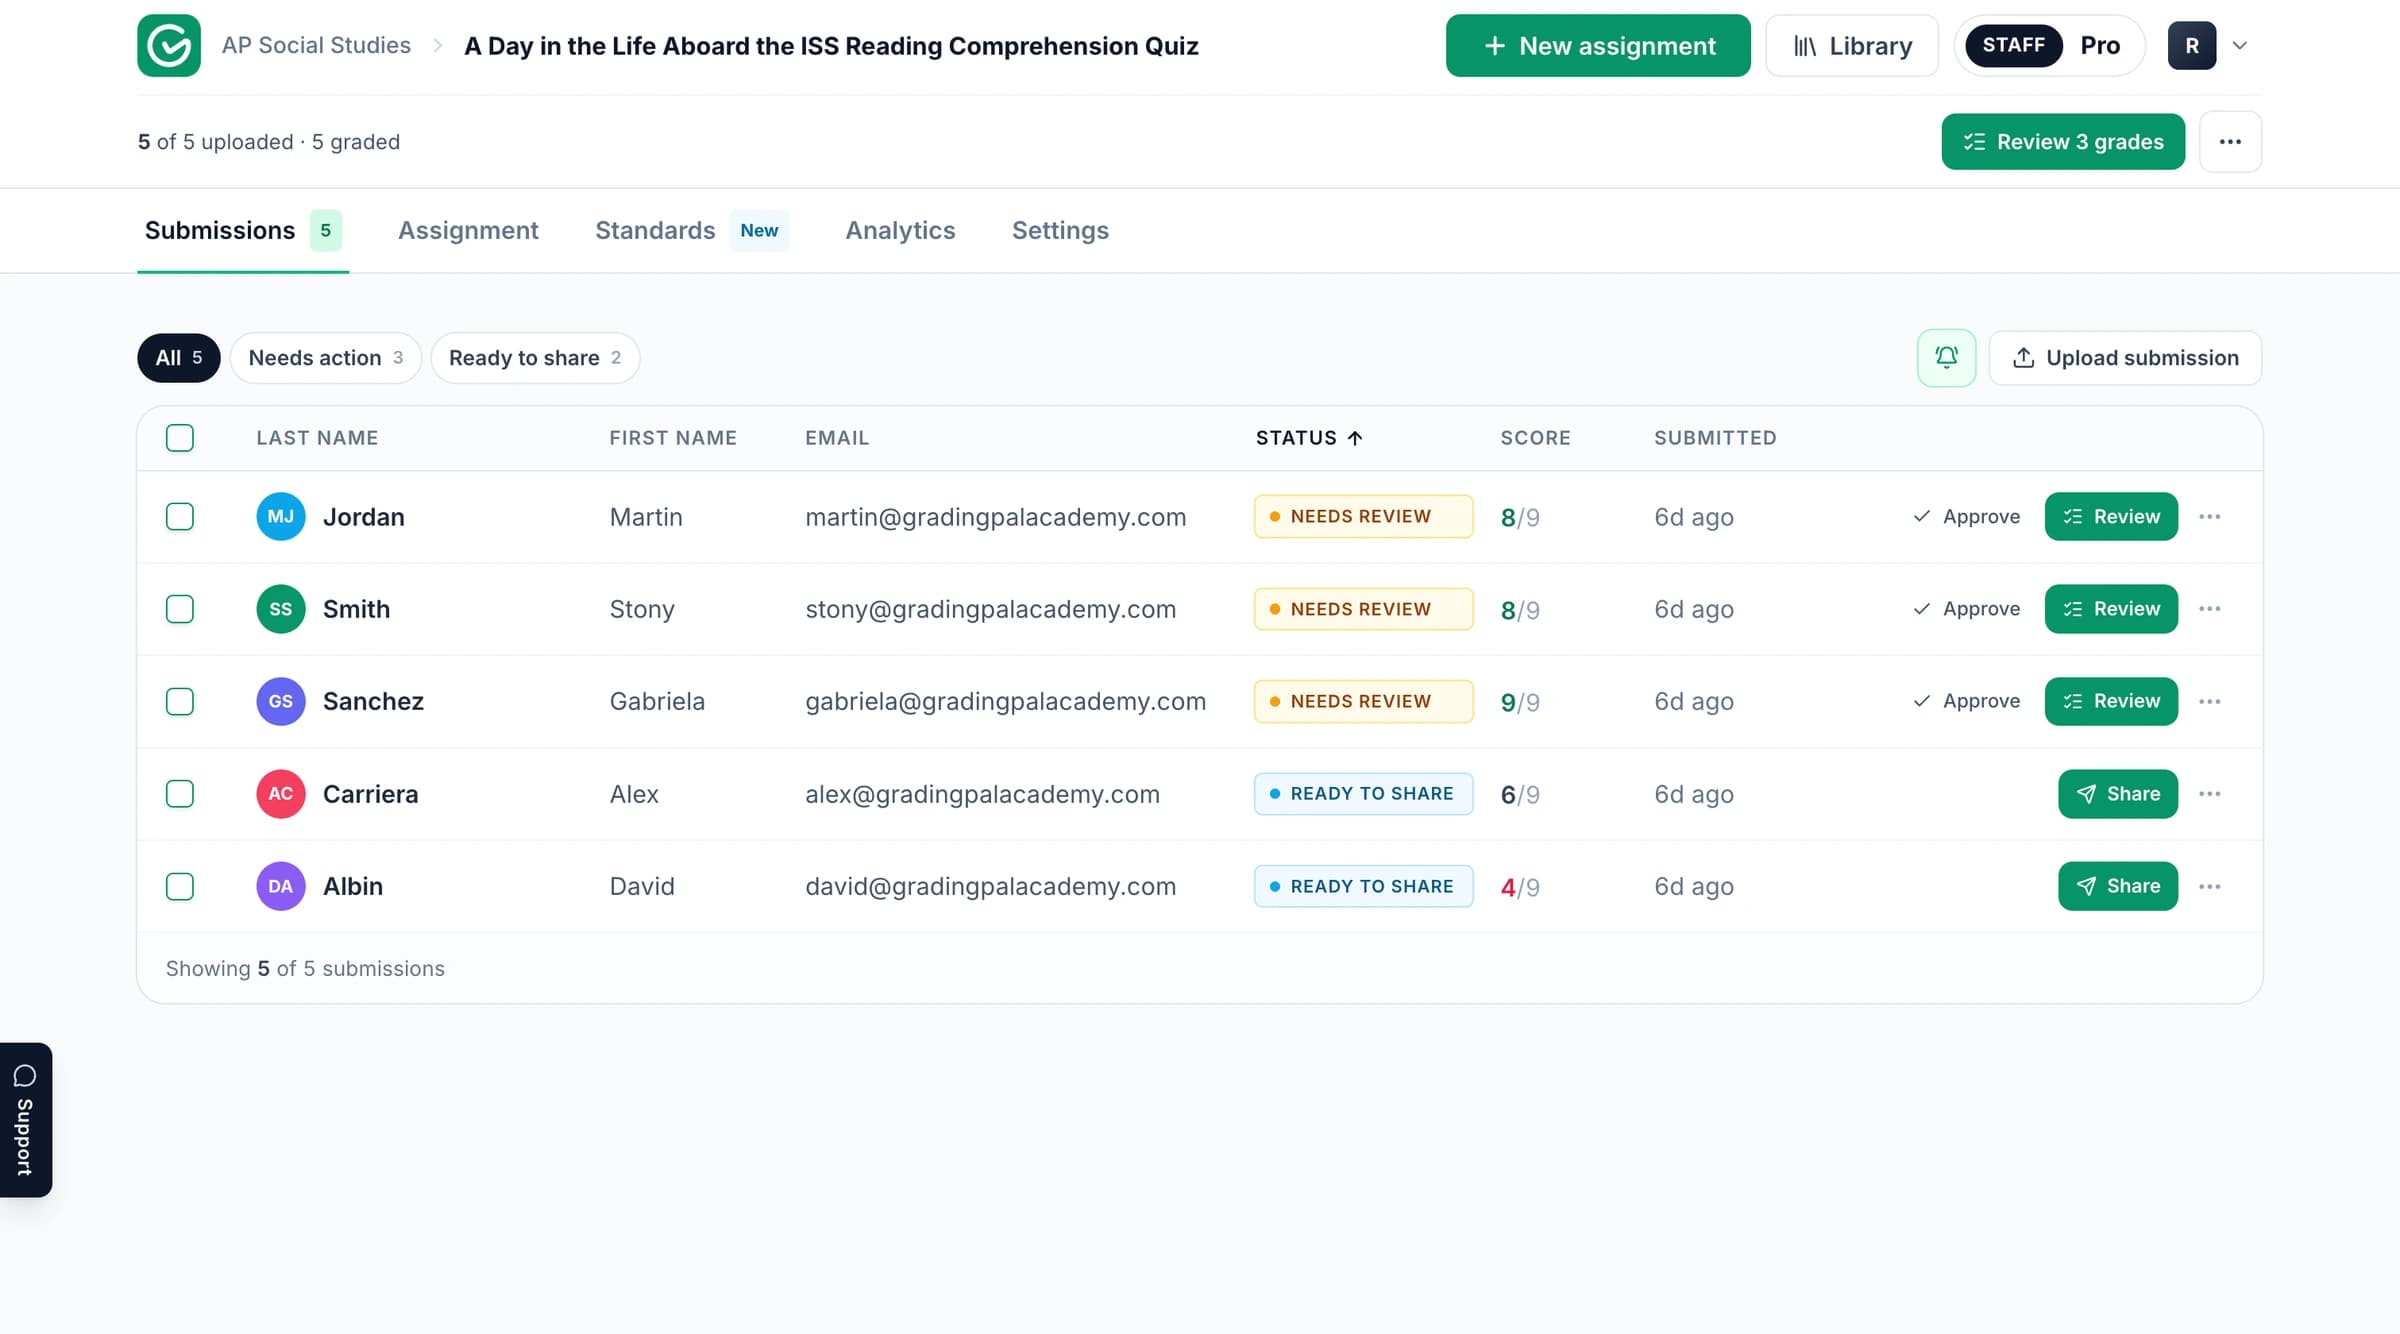
The GradingPal workspace. Product context; the published example and its media follow below.
Read the assignment and assessment example
Explore the original task and supporting material below. Follow the connection between the student’s response, the criteria being assessed, and the resulting assessment. The example provides its own context and evidence.
GradingPal is an AI grading assistant for teachers: upload student work and a rubric, and it drafts scores and specific, evidence-based feedback for you to review, edit, and release. In this use case, we'll follow a middle school science inquiry project from individual grading all the way to a class-wide reteach plan.
The problem
Open-ended inquiry projects are exactly what NGSS asks for, and exactly what's hardest to grade at scale. Every student asks a different question, runs a different investigation, and presents it differently, so there's no answer key to check against, only whether the reasoning holds up: does the data actually support the conclusion, does the hypothesis follow the required structure, is the procedure detailed enough for someone else to repeat it.
And even once every project is graded, the harder question remains unanswered: what does the whole class actually need next? A stack of 28 individual scores doesn't add up to a lesson plan on its own. Someone has to tally which rubric criteria came in weak, across how many students, and turn that into a reteach priority, and that tallying almost never happens by hand.
This is where GradingPal helps twice over. It grades each investigation against your rubric with evidence pulled from the student's own slides, and then rolls every submission up into a class-level view that tells you exactly what to teach next.
The assignment
In this middle school science seminar, each student designs their own investigation from scratch. They pose a scientific question, write a hypothesis, run a simple hands-on test, collect data, and present the whole arc as a slide deck. Topics are genuinely student-chosen: one student asks how the amount of sugar in water affects its viscosity; another asks what music helps them focus while working.
That range is the point and the challenge. A rigorously testable question about viscosity and a more personal, subjective one about music both have to be graded fairly, on the same rubric, for the same underlying skill: can this student ask a real question, test it honestly, and reason from the data to a conclusion.
The rubric
The seven-criterion inquiry rubric inside GradingPal
Rubric
The teacher applies a seven-criterion rubric worth 45 points: Question, Hypothesis, Procedure, Data and Observations, Conclusion, Mechanics, and Visual Display, each scored on a five-level scale from Missing to Advanced.
The weighting is deliberate. Data and Observations and Conclusion are each worth twice as much as the other criteria, which puts the emphasis exactly where good scientific reasoning lives: not on how polished the slides look, but on whether the data is displayed clearly and the conclusion actually follows from it, with sources of error acknowledged. A student can lose points on mechanics and still pass comfortably; they can't do that on a conclusion that doesn't hold up.
And it's checking for specific, named things within each level, not just overall polish. Full marks on the Question criterion require not only a clear, scientifically answerable question but a genuine personal explanation of why the investigation matters to that student. It's your rubric, applied the same way to every submission, whether you upload it as-is, build it in GradingPal, or draft it from the assignment and edit from there.
The graded submissions
The teacher uploads each student's slide deck, and GradingPal reads it and scores it criterion by criterion, with every score grounded in the student's own words.
The graded submission: slide deck with rubric scores and quoted evidence
Rubric-based scoring
Personalized student feedback
1 / 2
The viscosity investigation scores 43 out of 45, and the Question criterion earns full marks at Advanced specifically because the student explained why the topic mattered to them personally, not just what the question was. GradingPal quotes the exact line back as evidence, so the teacher can see precisely what earned the score rather than trusting a number alone.
The music-and-focus project shows how the feedback handles a more exploratory investigation. The overall comment calls the project creative and practical, credits the student's real peer data collection, the classroom survey, the visual album art, and then gives one clear next step: bring more formal structure to the hypothesis, the data, and the conclusion. It even reads a line from the student's own conclusion, that other people have different taste in music, as a sign of real scientific-reasoning maturity: recognizing that individual variability is itself a result worth noting. Nothing goes to the student until the teacher says so, and every score and comment is editable before it's released.
Classwide analytics
The class dashboard: score distribution, strengths and weaknesses, and reteach recommendations
Class performance overview
Common strengths & weaknesses
Recommendations for growth
1 / 3
This is where grading 28 individual projects turns into one picture of the class. The dashboard opens with the basics: a class mean of 80.5%, scores ranging from 67 to 98, and 28 of 30 students submitted. Then it goes further than a spreadsheet would on its own, with an AI-written summary of the pattern underneath the numbers: students grasp the visible structure of a science presentation, but the deeper habits, justifying choices, documenting methods precisely, using results as actual evidence, are where quality drops.
A strengths-and-weaknesses view ranks exactly which rubric criteria the class handled well and which it didn't, each tagged with how many students it affects. Strong visual organization shows up in half the class. Missing complete data displays, a table without its matching graph, caps the Data score for half the class as well, even when the raw numbers were collected. Roughly a third of students asked a good question but never explained why it mattered to them.
And it doesn't stop at diagnosis. The dashboard ranks five concrete reteach recommendations, each quantified by how much of the class it would help and tagged with a suggested format: a whole-class reteach on evidence-based conclusions for 40% of students, explicit modeling of complete data tables and graphs for 47%, a small-group lesson on writing replicable procedures for 43%. Every recommendation is grounded in that specific class's actual rubric performance, not generic teaching advice, so the next lesson is chosen by the data instead of a hunch.
The outcome
Here's what changes when an inquiry project runs through GradingPal:
The teacher grades open-ended, student-designed investigations consistently, with evidence quoted from each student's own slides, and never has to manually tally which rubric criteria the class struggled with.
The student gets feedback tied to their actual investigation, whether it's a rigorously testable question or a more personal one, recognizing why this specific choice mattered and where the reasoning needs to go further. That's feedback a generic rubric checklist can't produce on its own.
And the class gets a reteach plan, not just a spreadsheet of scores: a ranked list of exactly which skills to revisit and how many students need it, grounded in that class's own data.
That's the point of an inquiry project in the first place. We don't just want students to fill out a slide template. We want them to ask a real question, test it honestly, and reason from evidence to a conclusion the way scientists do, and we want the next lesson shaped by how well the class actually did that. GradingPal makes both halves practical, every time.
Review the scoring and feedback with your task in mind
Start with what the learner was asked to demonstrate. Check the submitted work alongside the rubric expectations and any scoring explanation included in the example. Consider whether the feedback identifies a specific strength or a next action the student can take.
When you grade your own work in GradingPal, review the proposed scores and supporting evidence before approving them. For a calculation, inspect methods and intermediate steps as well as the answer. For an explanation, examine the relationship between the claim, evidence, and reasoning. Your rubric determines what earns credit.
Take the assessment further in GradingPal
GradingPal combines rubric scoring with individual feedback, standards mastery, and classroom analytics. These are product capabilities to explore for your own teaching; the published example above demonstrates the material contained in its original record.
Shape the feedback students receive
Choose Targeted, Glow & Grow, Structured, Sandwich, Actionable, or Socratic feedback. Set detail, supported language, and instructions for your teaching voice, then review the comments before sharing. Explore student feedback.
Track progress beyond one assignment
Approved, aligned evidence can contribute to a standards mastery record across assessments. Inspect the original work, choose among five calculation methods, and use teacher adjustments with a reason. Explore standards mastery.
Plan the next teaching step
Classroom analytics surface strengths, weaknesses, and recommended instructional next steps. Use the evidence to consider targeted practice, small-group support, or a class explanation. Explore analytics.
Reuse criteria across your team
Copy and edit a starting point from the 500-rubric catalog, or bring your existing rubric. Shared assignment and rubric libraries on eligible plans help colleagues reuse assessment resources. Explore the rubric library.
Explore more assessment examples
Continue with related published examples below or browse the full collection. GradingPal supports writing, math, science, handwritten work, worksheets, exams, slides, and supported recordings; the grader pages explain the wider product range.
See how GradingPal prepares rubric scores, explains the credit with evidence, and writes individual feedback for review. Start with 50 submissions per month on the free plan and check pricing for feature and format access.